Plotting a Sample Portrait
Refer to this page to learn about how to use the Sample Portrait function. Included below is the function and a list of valid parameter values. There is also an example of the Sample Portrait.
samplePortrait Function
Outputs a file with the different substitution, indel, and dinucleotide graphs.
samplePortrait(matrix, output_path, project, percentage=False)
For those using the R-wrapper, you must switch any "True" to "TRUE", "False" to "FALSE", and "None" to "NULL."
- matrix_path -> (String) The path to your matrix (generated by SigProfilerMatrixGenerator).
- output_path -> (String) The path to where the output will be saved.
- project -> (String) The output file will have this value postfixed in the name.
- percentage -> (Boolean) True for a normalized percentile plot and False for a numerical plot. This parameter has a default value of False.
To create a sample portrait, ensure that you have a matrix for all required contexts (SBS-6, SBS-24, SBS-96, SBS-384, SBS-1536, DBS-78, DBS-312, ID-83, ID-28, ID-96).
plotDBS Examples
The following examples were generated in a python environment where sample_portrait was imported as sP from sigProfilerPlotting.
$python3
>>from sigProfilerPlotting import sample_portrait as sP
From within a R session:
$ R
>> library("reticulate")
>> use_python("path_to_your_python3")
>> py_config()
>> library("SigProfilerPlottingR")
The Sample Portrait
From within a Python session:
sP.samplePortrait(sample_matrices_path, output_path, project, percentage=False)
From within a R session:
samplePortrait(sample_matrices_path, output_path, project, percentage=FALSE)
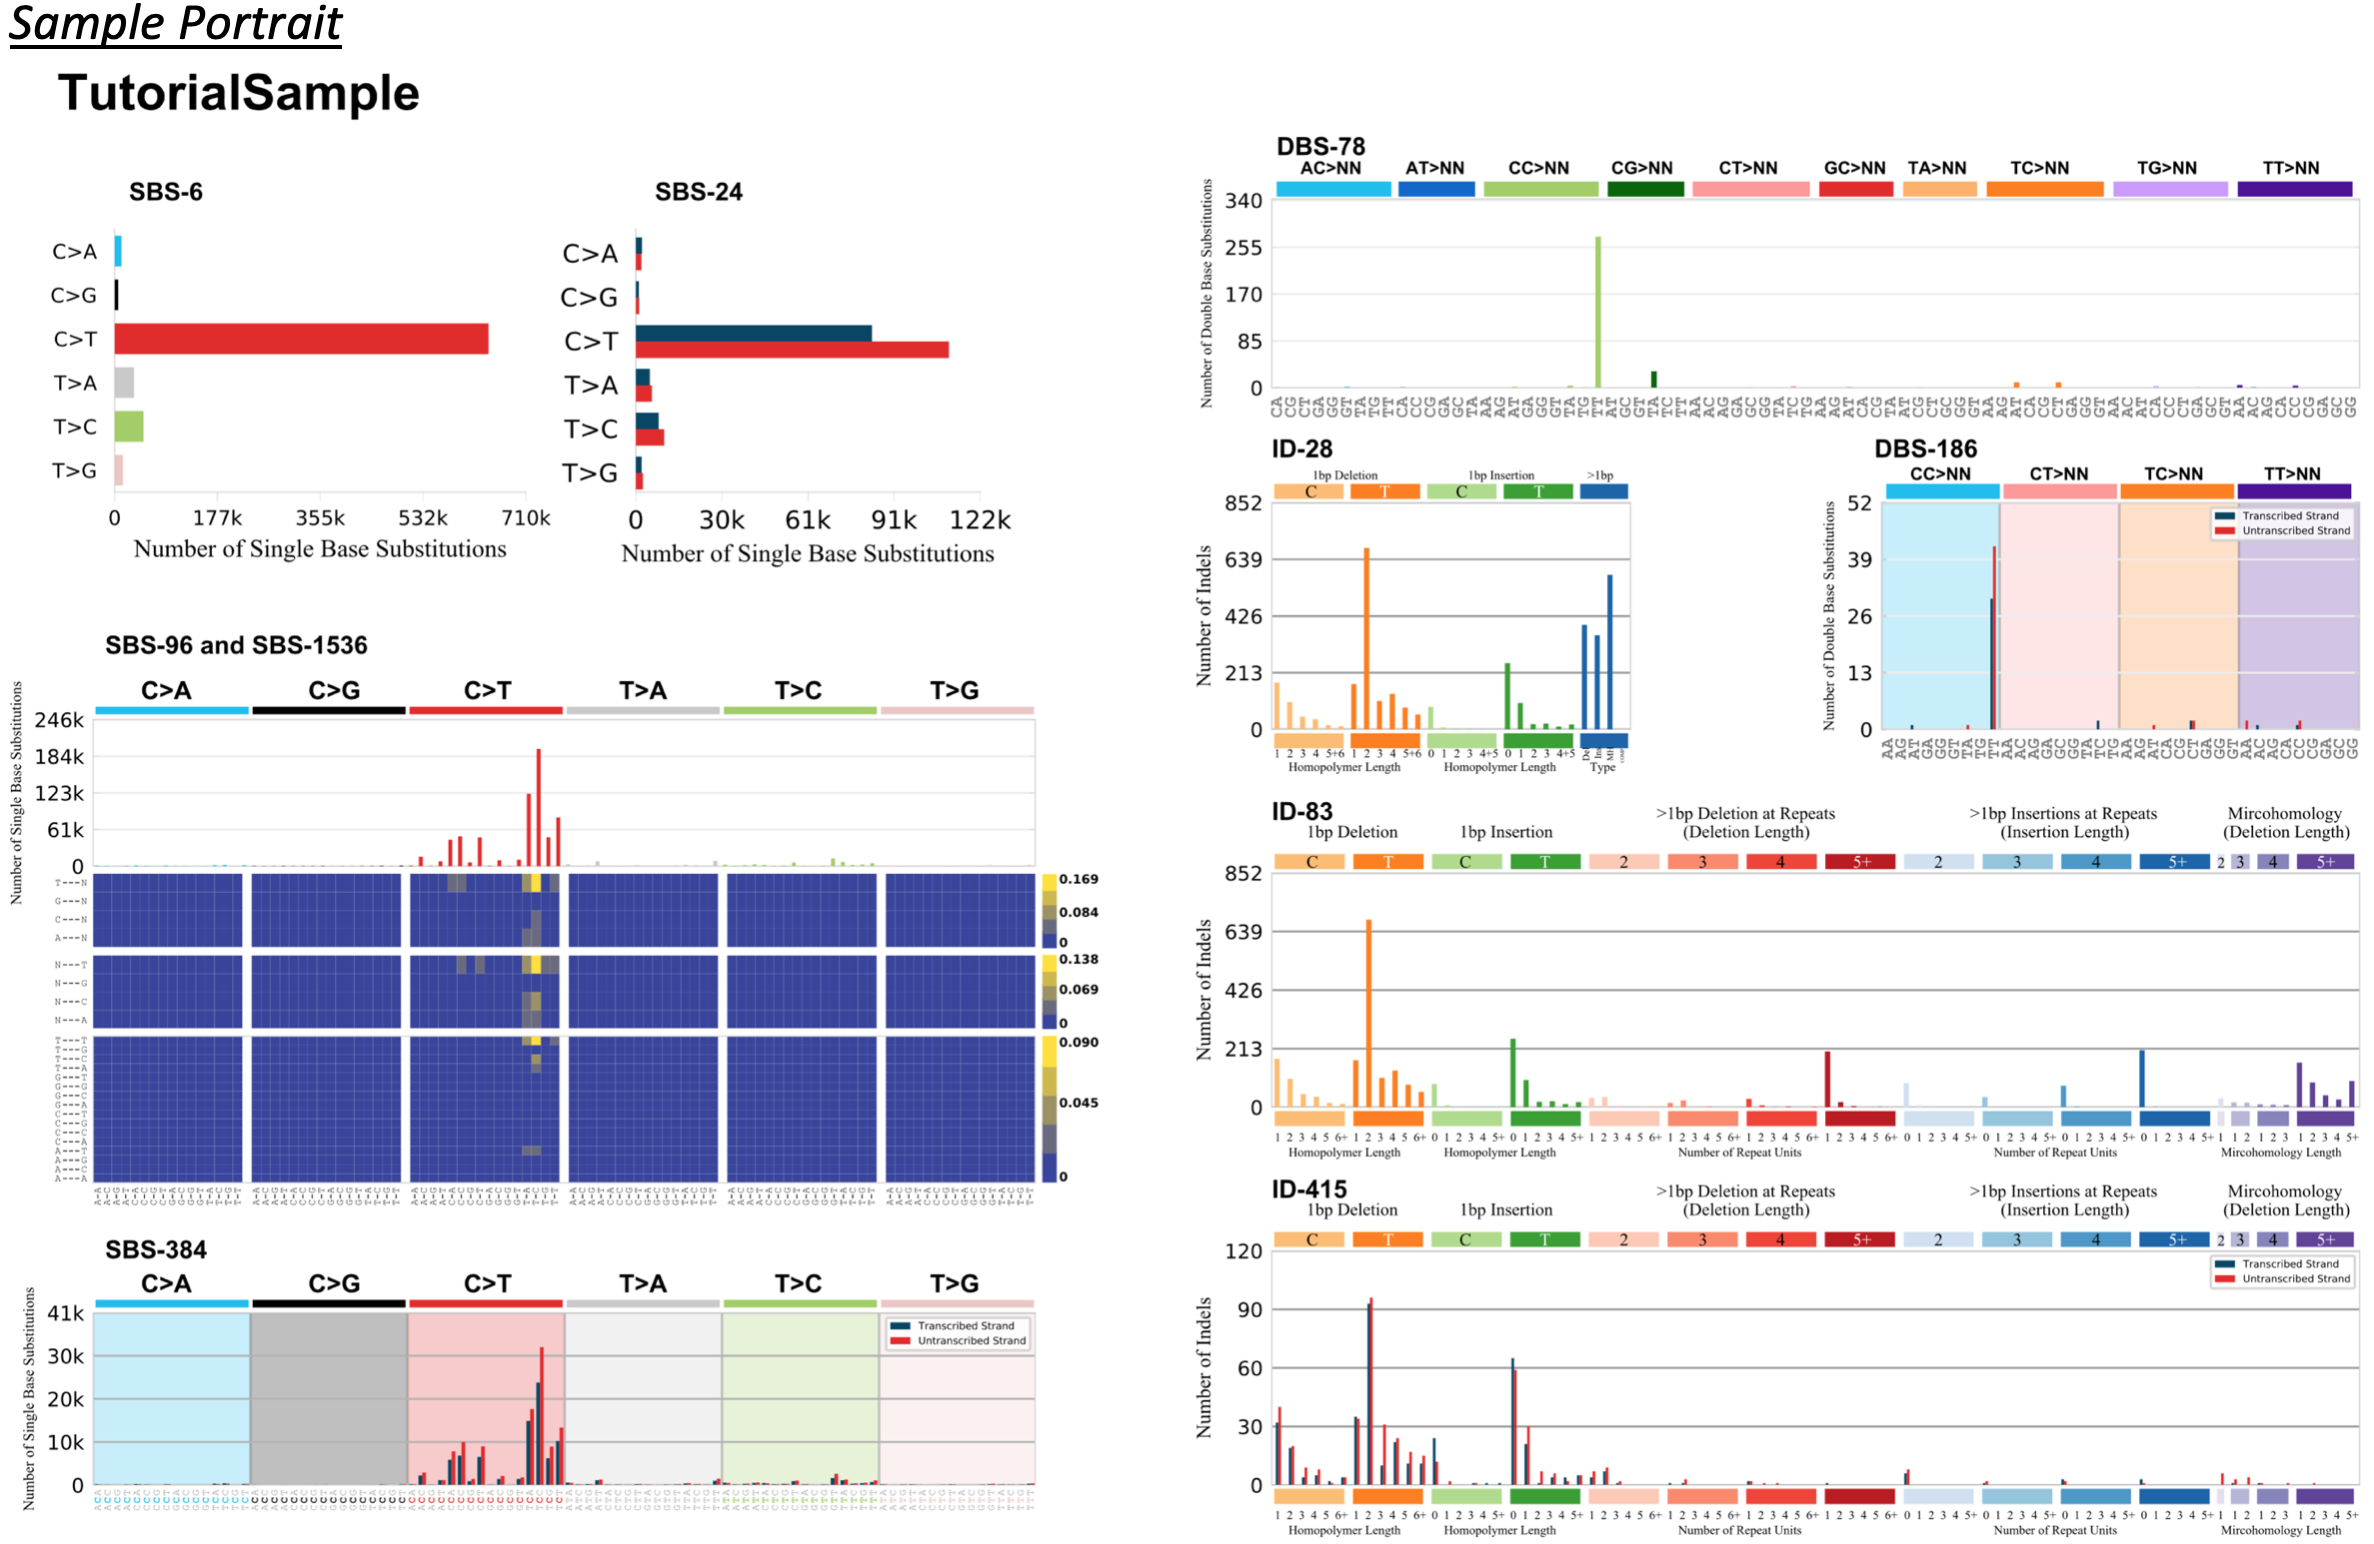
This collection of graphs includes the variations that are produced by each function. To produce an individual graph found in the collection, navigate to Plotting Susbtitutions, Plotting Indels, or Plotting Dinucleotides, and call the corresponding function.