Plotting Indels
Refer to this page to learn about how to plot small insertions and deletions (indels) using the plotID function. Included below is the function and a list of valid parameter values. There are also examples of each indel graph with a quick description for interpreting it.
plotID Function
Plots the number of small insertions, deletions, and microhomologies.
plotID(matrix_path, output_path, project, plot_type, percentage=False, custom_text_upper=None, custom_text_middle=None, custom_text_lower=None)
For those using the R-wrapper, you must switch all "False" to "FALSE", "True" to "TRUE", and "None" to "NULL."
- matrix_path -> (String) The path to your matrix (generated by SigProfilerMatrixGenerator).
- output_path -> (String) The path to where the output will be saved.
- project -> (String) The output file will have this value postfixed in the name.
- plot type -> (String) The plot type to be generated. Valid inputs include {"28", "83", "415"}.
- percentage -> (Boolean) True for a normalized percentile plot and False for a numerical plot. This parameter has a default value of False.
- custom_text_upper, custom_text_middle, custom_text_bottom -> (List of Strings) Provide a list of strings for adding a custom text to the upper right-hand corner of the plot. Ideally, there should be one string per sample. Extra strings will not be plotted. The three parameters allow for three rows of custom text (upper, middle, lower).
Supported SigProfiler Matrices include: 28 (ID_Simple), 83, and 415.
plotID Examples
The following examples were generated in a python environment where sigProfilerPlotting was imported as sigPlt.
$ python3
>>import sigProfilerPlotting as sigPlt
From within a R session:
$ R
>> library("reticulate")
>> use_python("path_to_your_python3")
>> py_config()
>> library("SigProfilerPlottingR")
The matrices below are used to generate the example plots. You can download and run the commands to generate the example plots. - ID Simple - ID-83 - ID-415
Plot ID_Simple
From within a Python session:
sigPlt.plotID(matrix_path_INDEL + "INDEL28.all", output_path, project_name, "28", percentage=False)
From within a R session:
plotID(matrix_path_INDEL + "INDEL28.all", output_path, project_name, "28", percentage=FALSE)
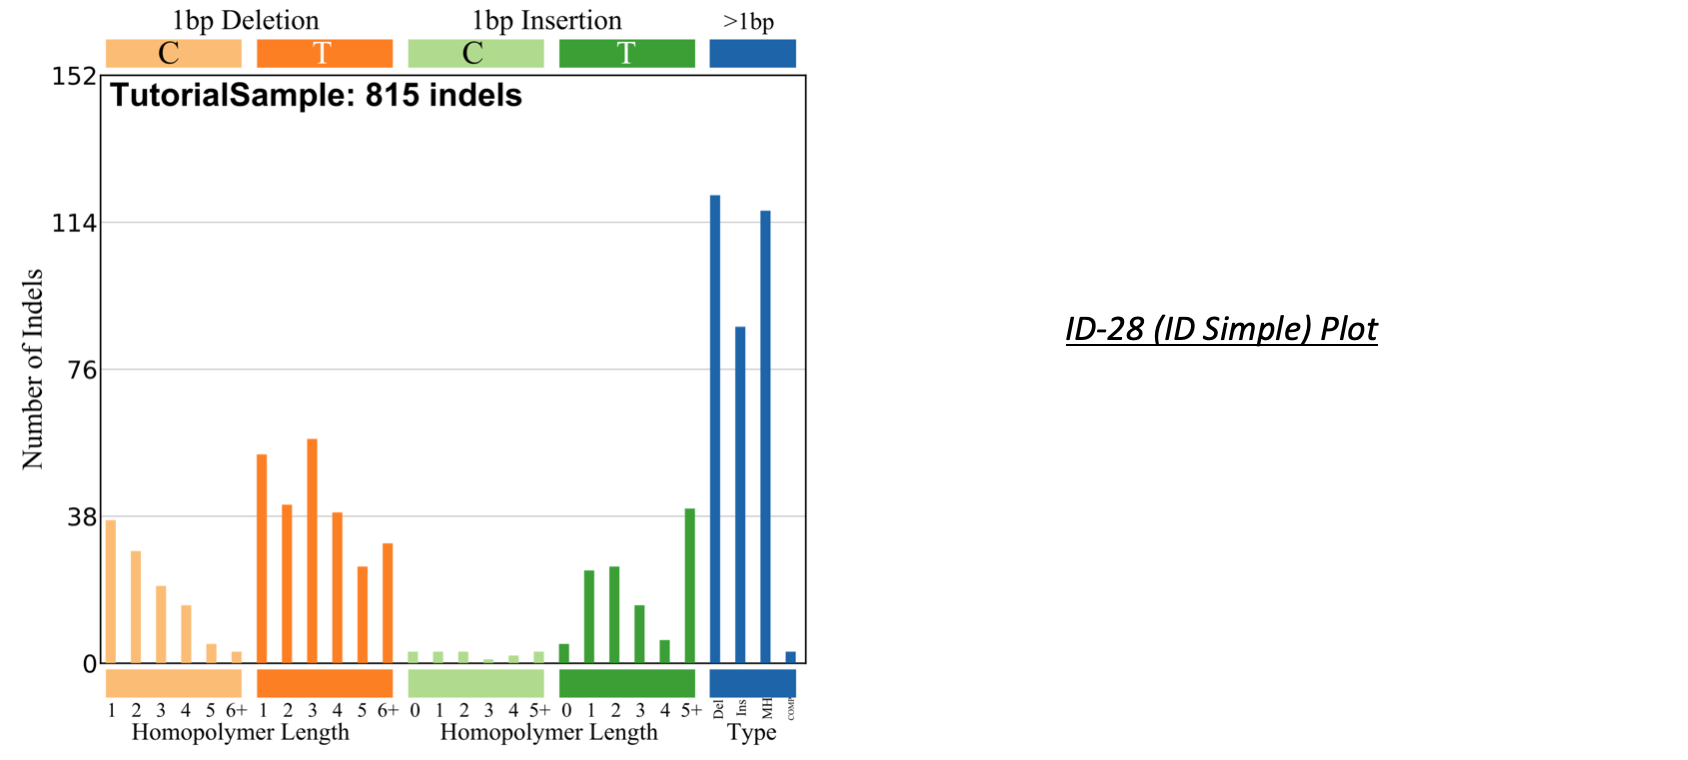 The Insertion Deletion Simple (ID-Simple) plot shows single base pair insertion and deletions with respect to the pyrimidine context. The x-axis represents the number of repeated bases of the given indel (homopolymer length). The y-axis is the number of mutations that occurred for the given category. On the far right of the plot, there are columns for large deletions, insertions, and microhomologies greater than one base pair. There is an additional column for complex indels which represent events that both deleted bases and inserted bases into the same region of the genome.
Plot ID-83
From within a Python session:
sigPlt.plotID(matrix_path_INDEL + "INDEL83.all", output_path, project_name, "83", percentage=False)
From within a R session:
plotID(matrix_path_INDEL + "INDEL83.all", output_path, project_name, "83", percentage=FALSE)
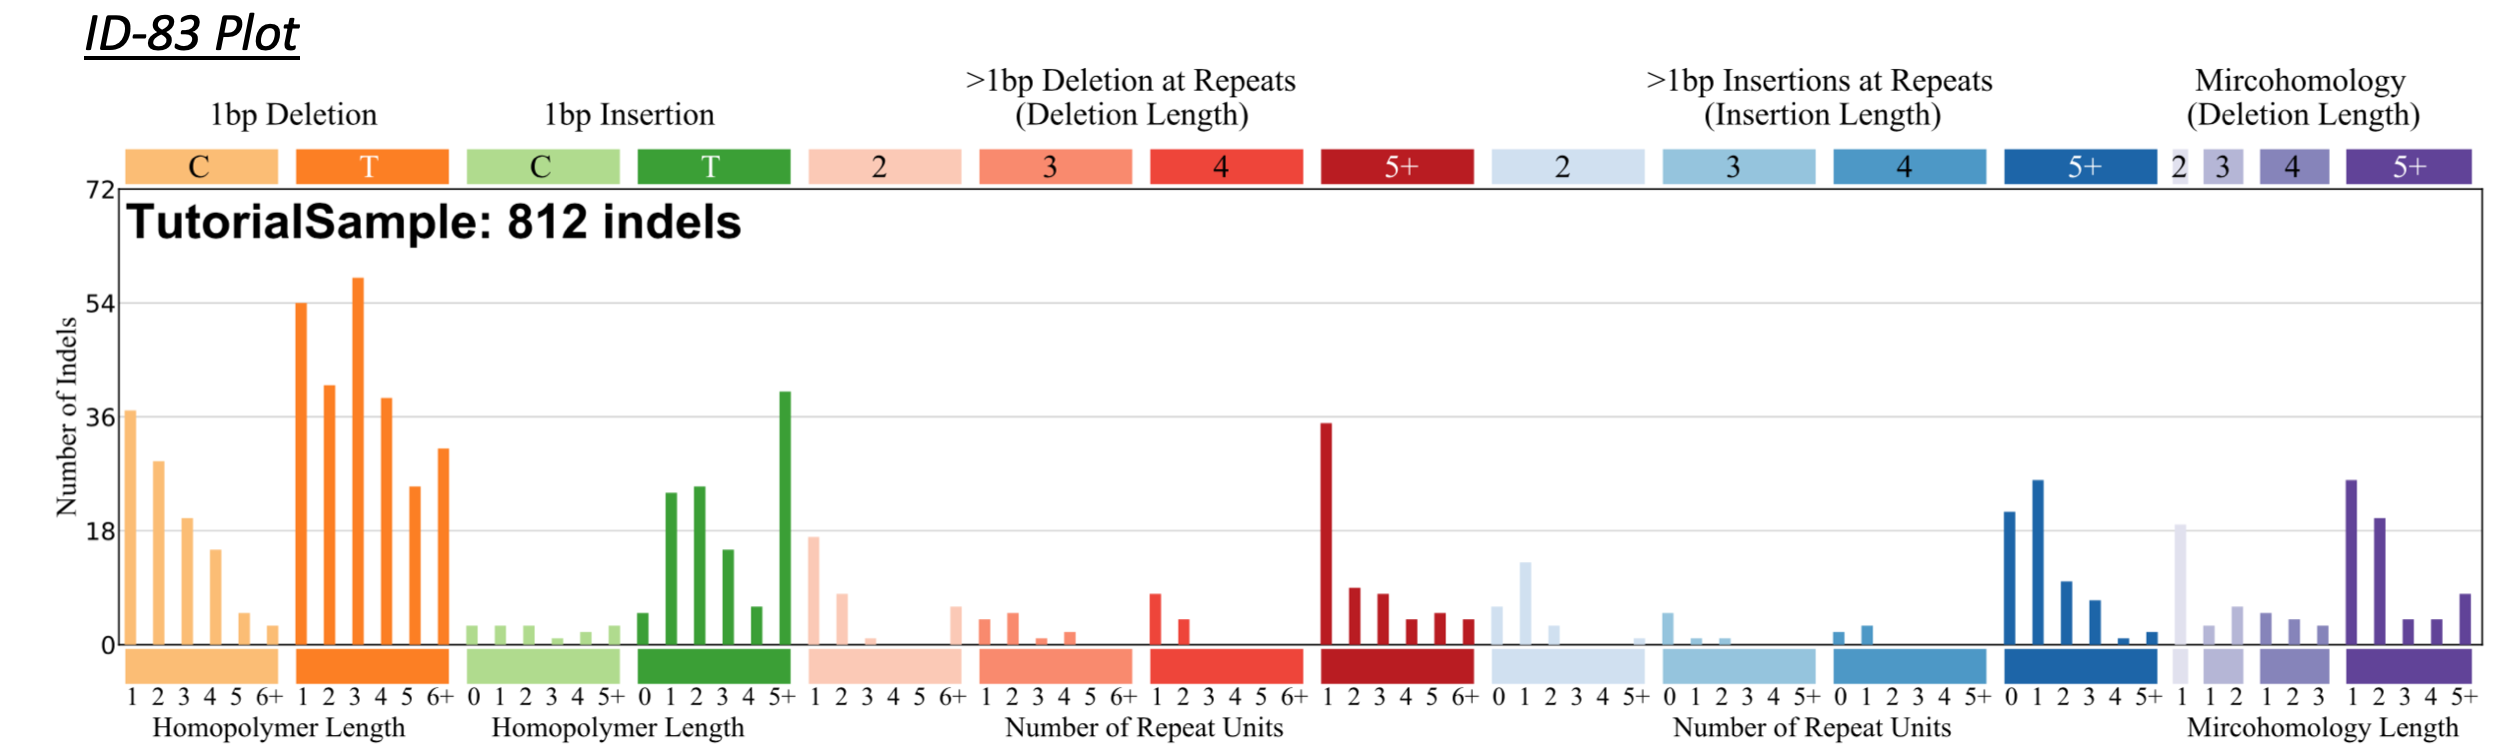 The Insertion Deletion-83 (ID-83) plot counts the number of small insertions and deletions that occur at a single base pair and at sequences of base pairs longer than one. The plot also displays microhomologies which are deletions that occur adjacent to a substring of the deleted sequence.
Plot ID-415
From within a Python session:
sigPlt.plotID(matrix_path_INDEL + "INDEL415.all", output_path, project_name, "415",False)
From within a R session:
plotID(matrix_path_INDEL + "INDEL415.all", output_path, project_name, "415",FALSE)
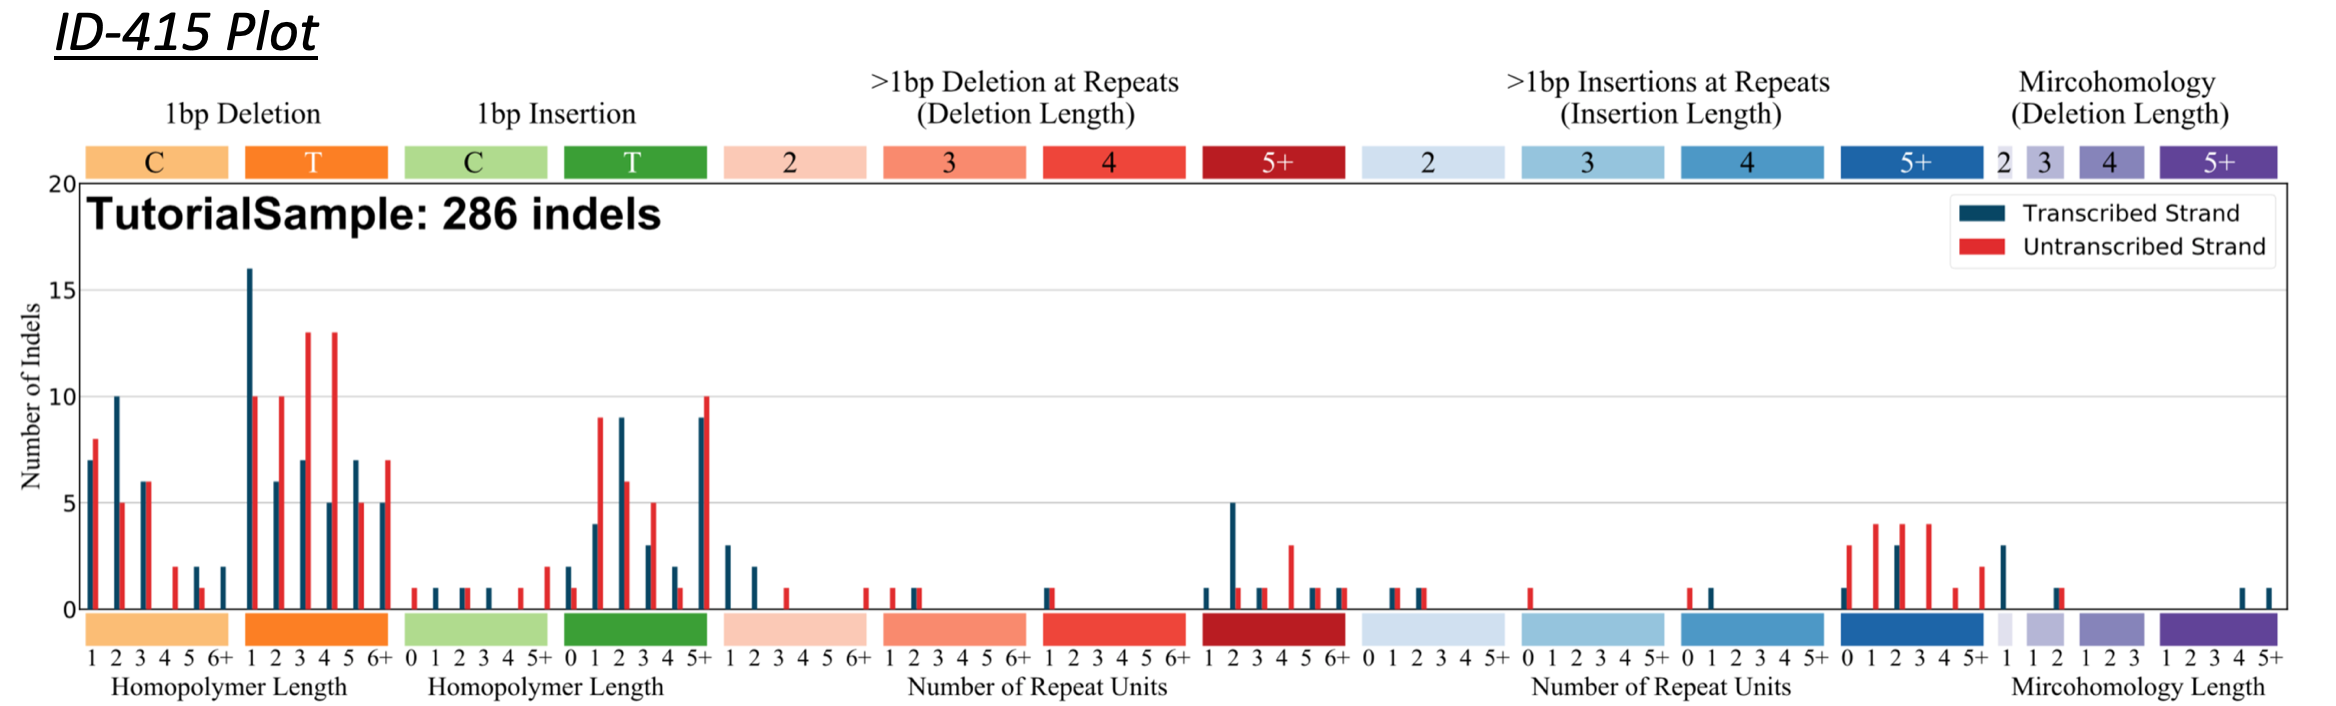 The Insertion Deletion-415 (ID415) plot counts the number of small insertions and deletions that occur at a single base pair and at sequences of base pairs longer than one. The plot also displays microhomologies which are deletions that occur adjacent to a substring of the deleted sequence. The plot shows the mutations that occur on the transcribed or untranscribed strands within protein-coding regions (bidirectional, non-transcribed, and unclassifiable indels are not plotted).