Example Program
Running the Example Program
After you have successfully installed SigProfilerPlotting, download SigProfilerPlottingExampleProgram.zip, and move it to your desktop and unzip it.
Next, open up your application terminal and enter the following command:
cd ~/Desktop/SigProfilerPlottingExampleProgram/
You can now run the example program by entering the command:
python3 plot_example.py
It may take a few seconds to complete. You can find the output graphs in the directory labeled plots, which is located in your current directory. If you are having difficulty locating the folder, open the finder application and press ⌘ + Shift + G and enter into the "Go to the Folder" drop down menu: ~/Desktop/SigProfilerPlottingExampleProgram/plots/
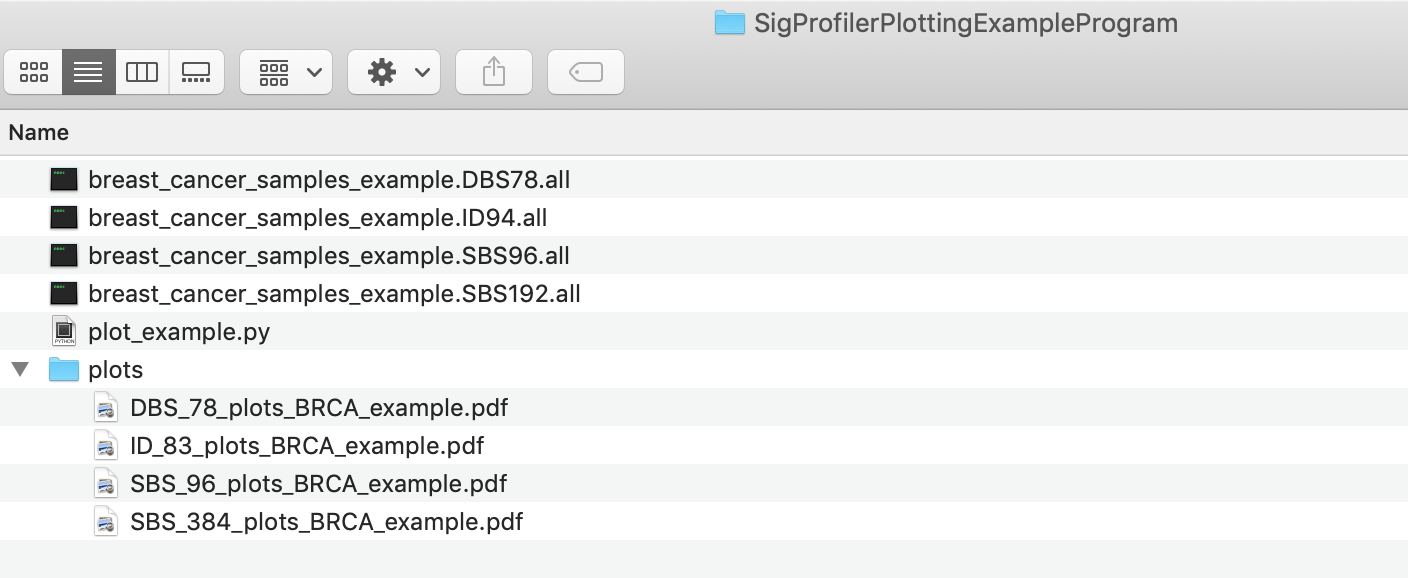
If you delete the four plot files and run plot_example.py then they should be generated again.
Now that you were able to run plot_example.py your environment is set up and you are ready to start writing your own applications. Take a look at the sections labeled Plotting Substitutions, Plotting Indels, and Plotting Dinucleotides for more details about the different functions that SigProfilerPlotting provides.