Plotting Dinucleotides
Refer to this page to learn about how to plot dinucleotides (DBS) using the plotDBS function. Included below is the function and a list of valid parameter values. There are also examples of each DBS graph with a quick description for interpreting it.
plotDBS Function
Plots the number of double base substitutions.
plotDBS(matrix_path, output_path, project, plot_type, percentage=False, custom_text_upper=None, custom_text_middle=None, custom_text_lower=None)
For those using the R-wrapper, you must switch any "True" to "TRUE", "False" to "FALSE", and "None" to "NULL."
- matrix_path -> (String) The path to your matrix (generated by SigProfilerMatrixGenerator).
- output_path -> (String) The path to where the output will be saved.
- project -> (String) The output file will have this value postfixed in the name.
- plot type -> (String) The plot type to be generated. Valid inputs include {"78", "312"}.
- percentage -> (Boolean) True for a normalized percentile plot and False for a numerical plot. This parameter has a default value of False.
- custom_text_upper, custom_text_middle, custom_text_bottom -> (List of Strings) Provide a list of strings for adding a custom text to the upper right-hand corner of the plot. Ideally, there should be one string per sample. Extra strings will not be plotted. The three parameters allow for three rows of custom text (upper, middle, lower).
Supported SigProfiler Matrices include: 78 and 186.
plotDBS Examples
The following examples were generated in a python environment where sigProfilerPlotting was imported as sigPlt.
$ python3
>>import sigProfilerPlotting as sigPlt
From within a R session:
$ R
>> library("reticulate")
>> use_python("path_to_your_python3")
>> py_config()
>> library("SigProfilerPlottingR")
The matrices below are used to generate the example plots. You can download and run the commands to generate the example plots. - DBS-78 - DBS-186
Plot DBS-78
From within a Python session:
sigPlt.plotDBS(matrix_path_DINUC + "DBS78.all", output_path, project_name, "78", percentage=False)
From within a R session:
plotDBS(matrix_path_DINUC + "DBS78.all", output_path, project_name, "78", percentage=FALSE)
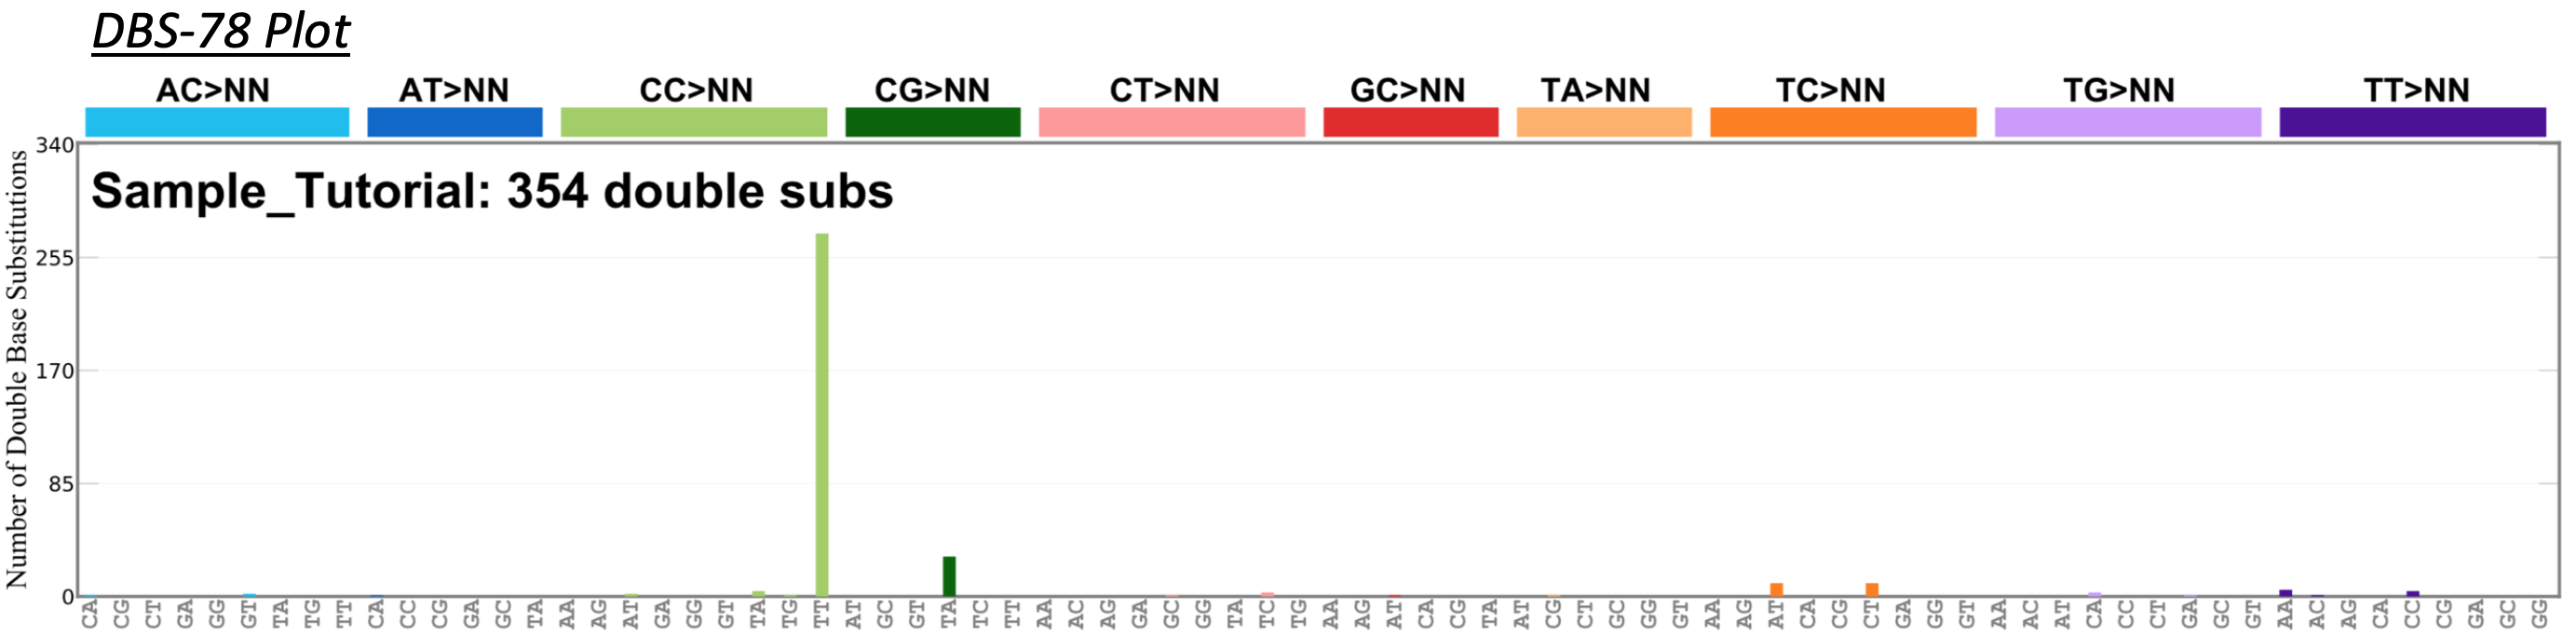 The Double Base Substitution-78 (DBS-78) plot counts the number of double base mutations. The DBS categories are listed along the top of the plot, and the number of each mutation are represented along the y-axis. The 78 mutational channels are determined using the maximum pyrimidine context of the mutation.
Plot DBS-186
From within a Python session:
sigPlt.plotDBS(matrix_path_DINUC + "DBS186.all", output_path, project_name, "186",False)
From within a R session:
plotDBS(matrix_path_DINUC + "DBS186.all", output_path, project_name, "186",FALSE)
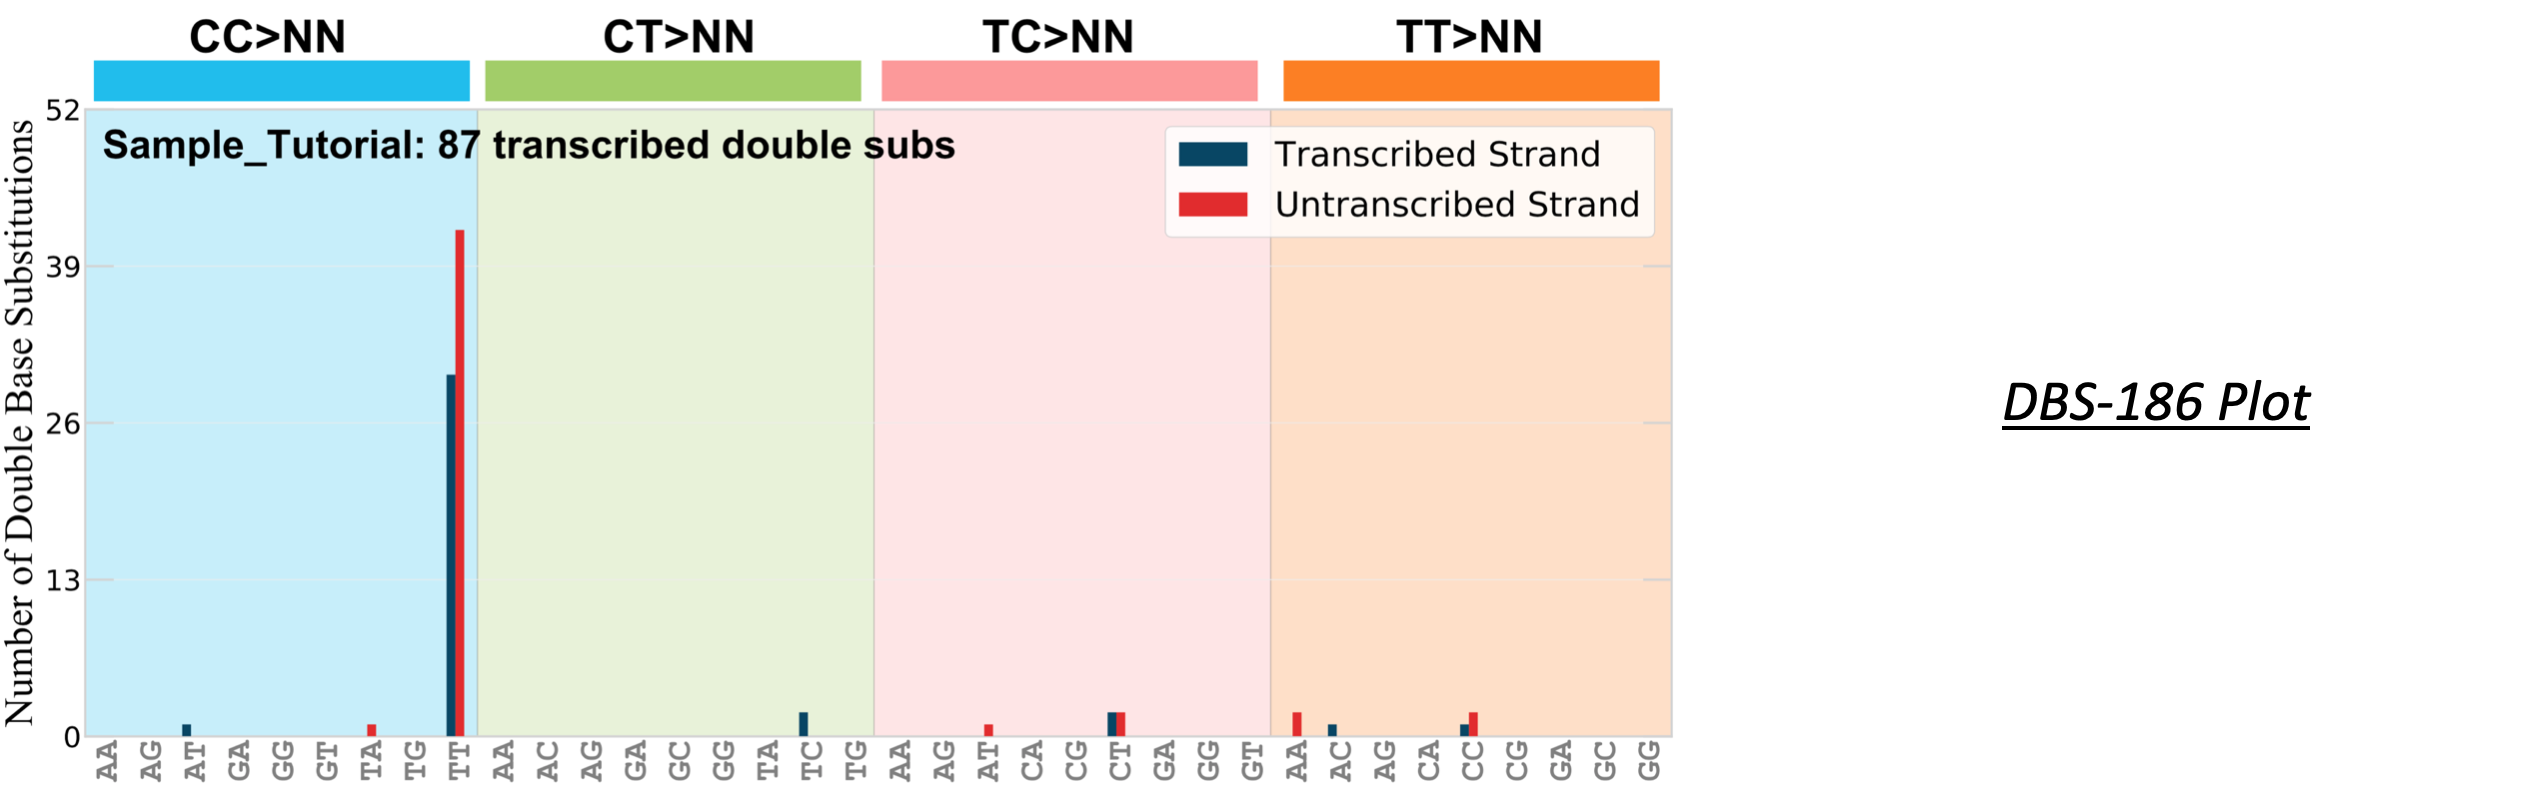 The Double Base Substitution-186 (DBS-186) plot counts the number of double base mutations that occur on the transcribed or untranscribed strands within protein coding regions. Only doublet-substitutions containing all pyrimidines or all purines can be classified this way. The DBS categories are listed along the top of the plot, and the number of each mutation are represented along the y-axis.