All_Solutions Directory
This section provides information on the files in the All_Solutions directory. The All_Solutions directory contains files organized into the three subdirectories: Activities, Signatures, and Solution_Stats. These directories are also in Output - Suggested Solution, and the information in this section is applicable to those files as well.
Output Overview
In the screenshot below, there are 10 different extracted signatures and a subdirectory for each of the 10 signatures containing the above mentioned files. The files examined below are from SBS96_3_Signatures.
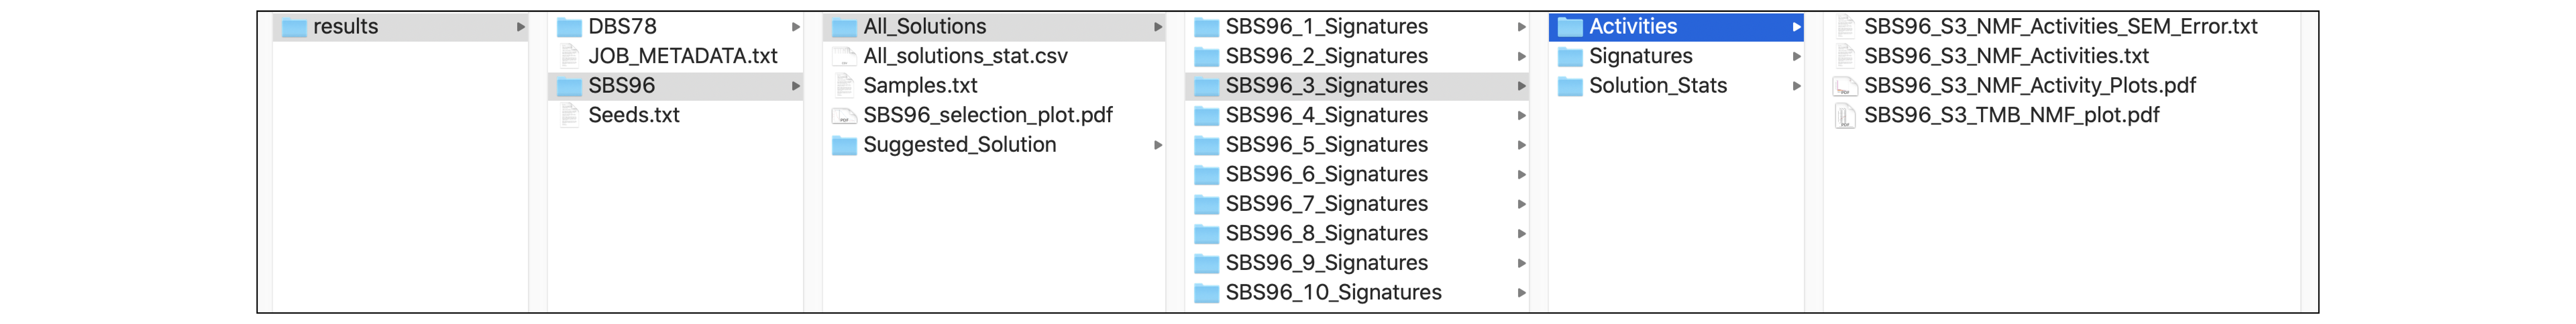
Each of the solution directories (SBS96_1_Signatures, ..., SBS96_10_Signatures) contains the subdirectories Activities, Signatures, and Solution_Stats. The files in their respective directories are listed below:
- Activities
- SBS96_S3_NMF_Activities_SEM_Error.txt
- SBS96_S3_NMF_Activities.txt
- SBS96_S3_NMF_Activity_Plots.pdf
- SBS96_S3_TMB_NMF_plot.pdf
- Signatures
- SBS96_S3_Signatures_SEM_Error.txt
- SBS96_S3_Signatures.txt
- Signature_plotSBS_96_plots_S3.pdf
- Solution_Stats
- SBS96_S3_NMF_Convergence_Information.txt
- SBS96_S3_Samples_stats.txt
- SBS96_S3_Signatures_stats.txt
Each filename in the Signatures subdirectory is prepended with the mutational context and signature number (ex. SBS96_S1), with the exception of the signature plots.
Activities Directory
SBS96_S3_NMF_Activities_SEM_Error.txt
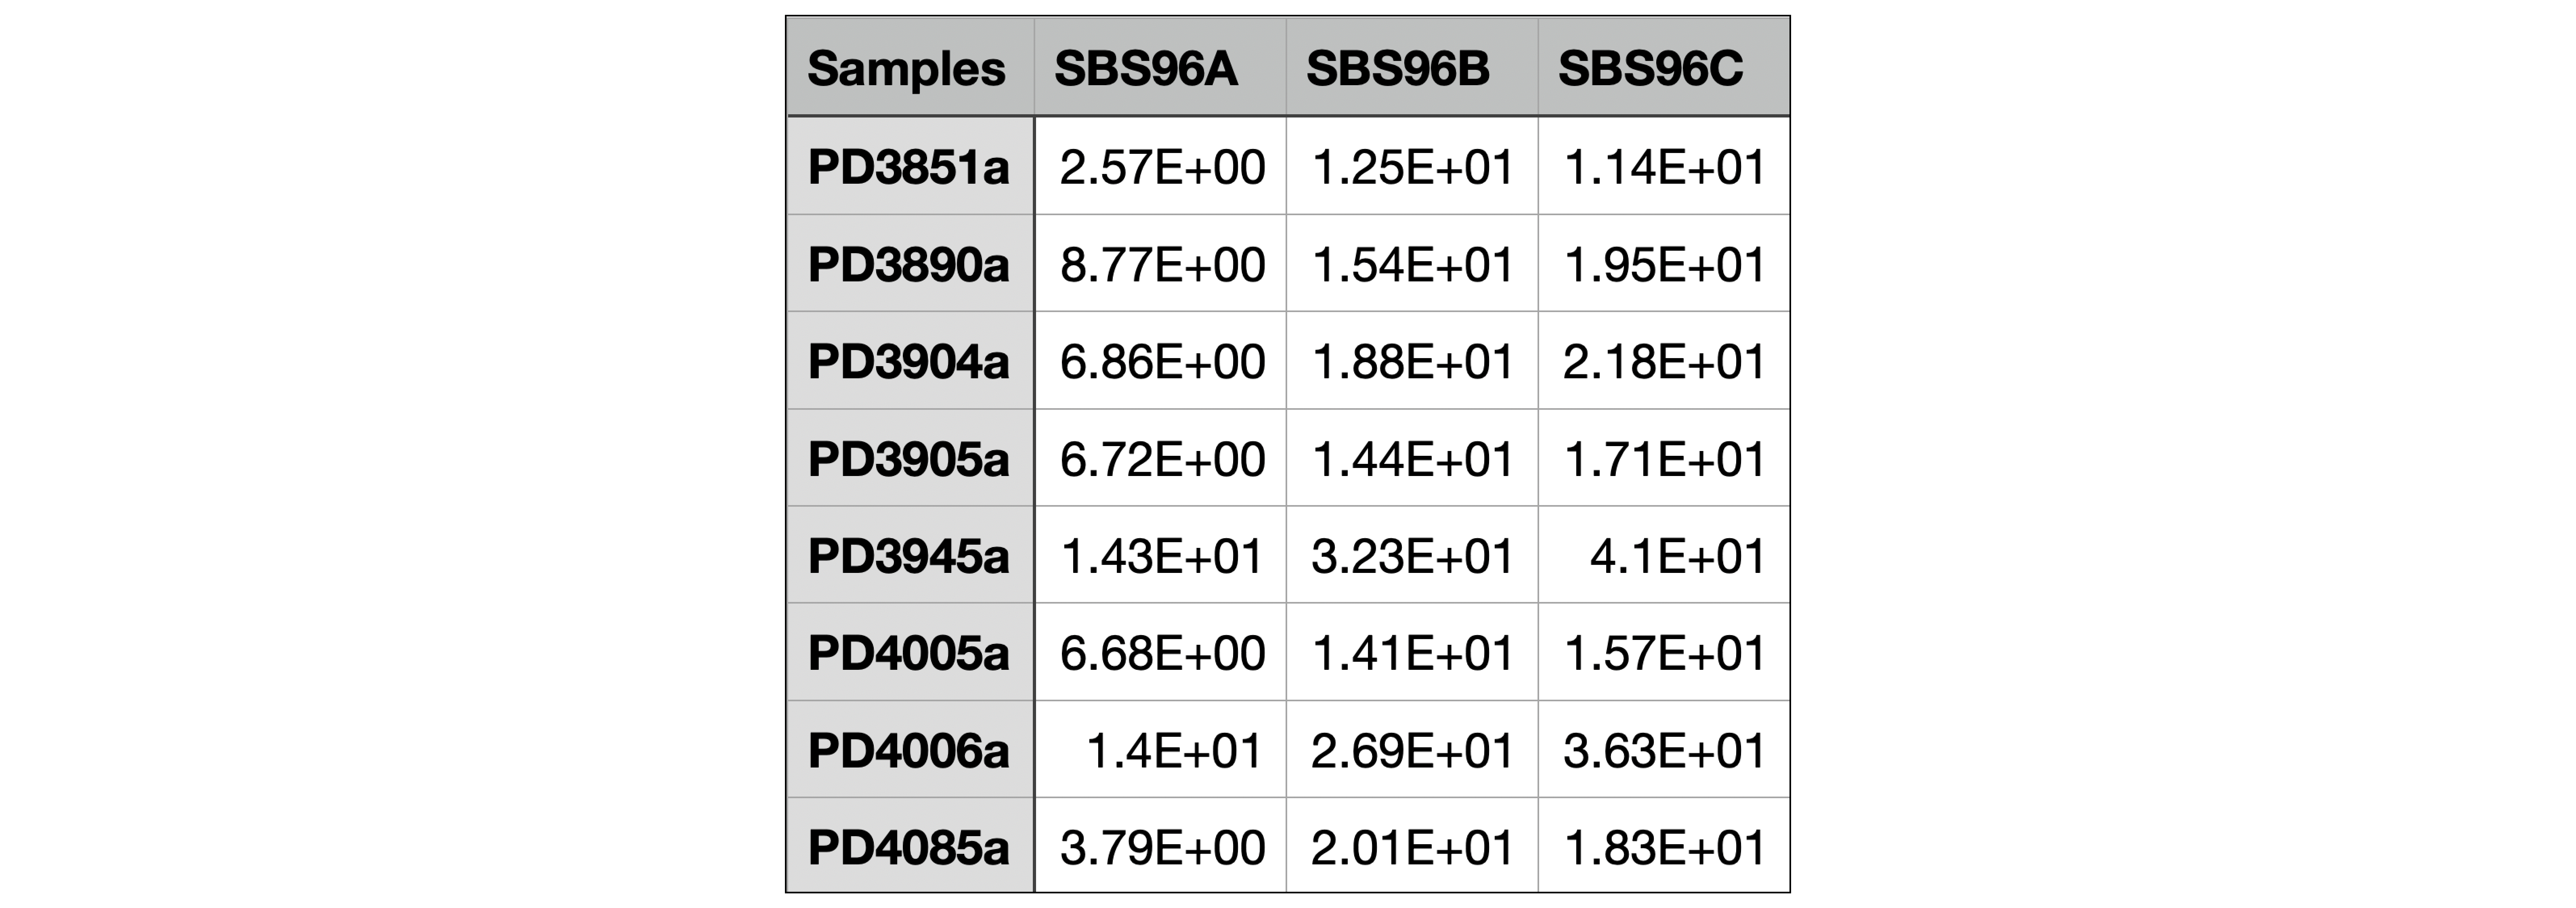
There are different activity matrices generated with each iteration, and from these the average is then calculated. The first column lists all of the samples, and the subsequent columns lists the error of the average (standard error) for each sample and the respective signature.
Below is a screenshot of the first few rows of a sample file, SBS96_S3_NMF_Activities_SEM_Error.txt. There were three signatures identified, SBS96A, SBS96B, and SBS96C.
SBS96_S3_NMF_Activities.txt
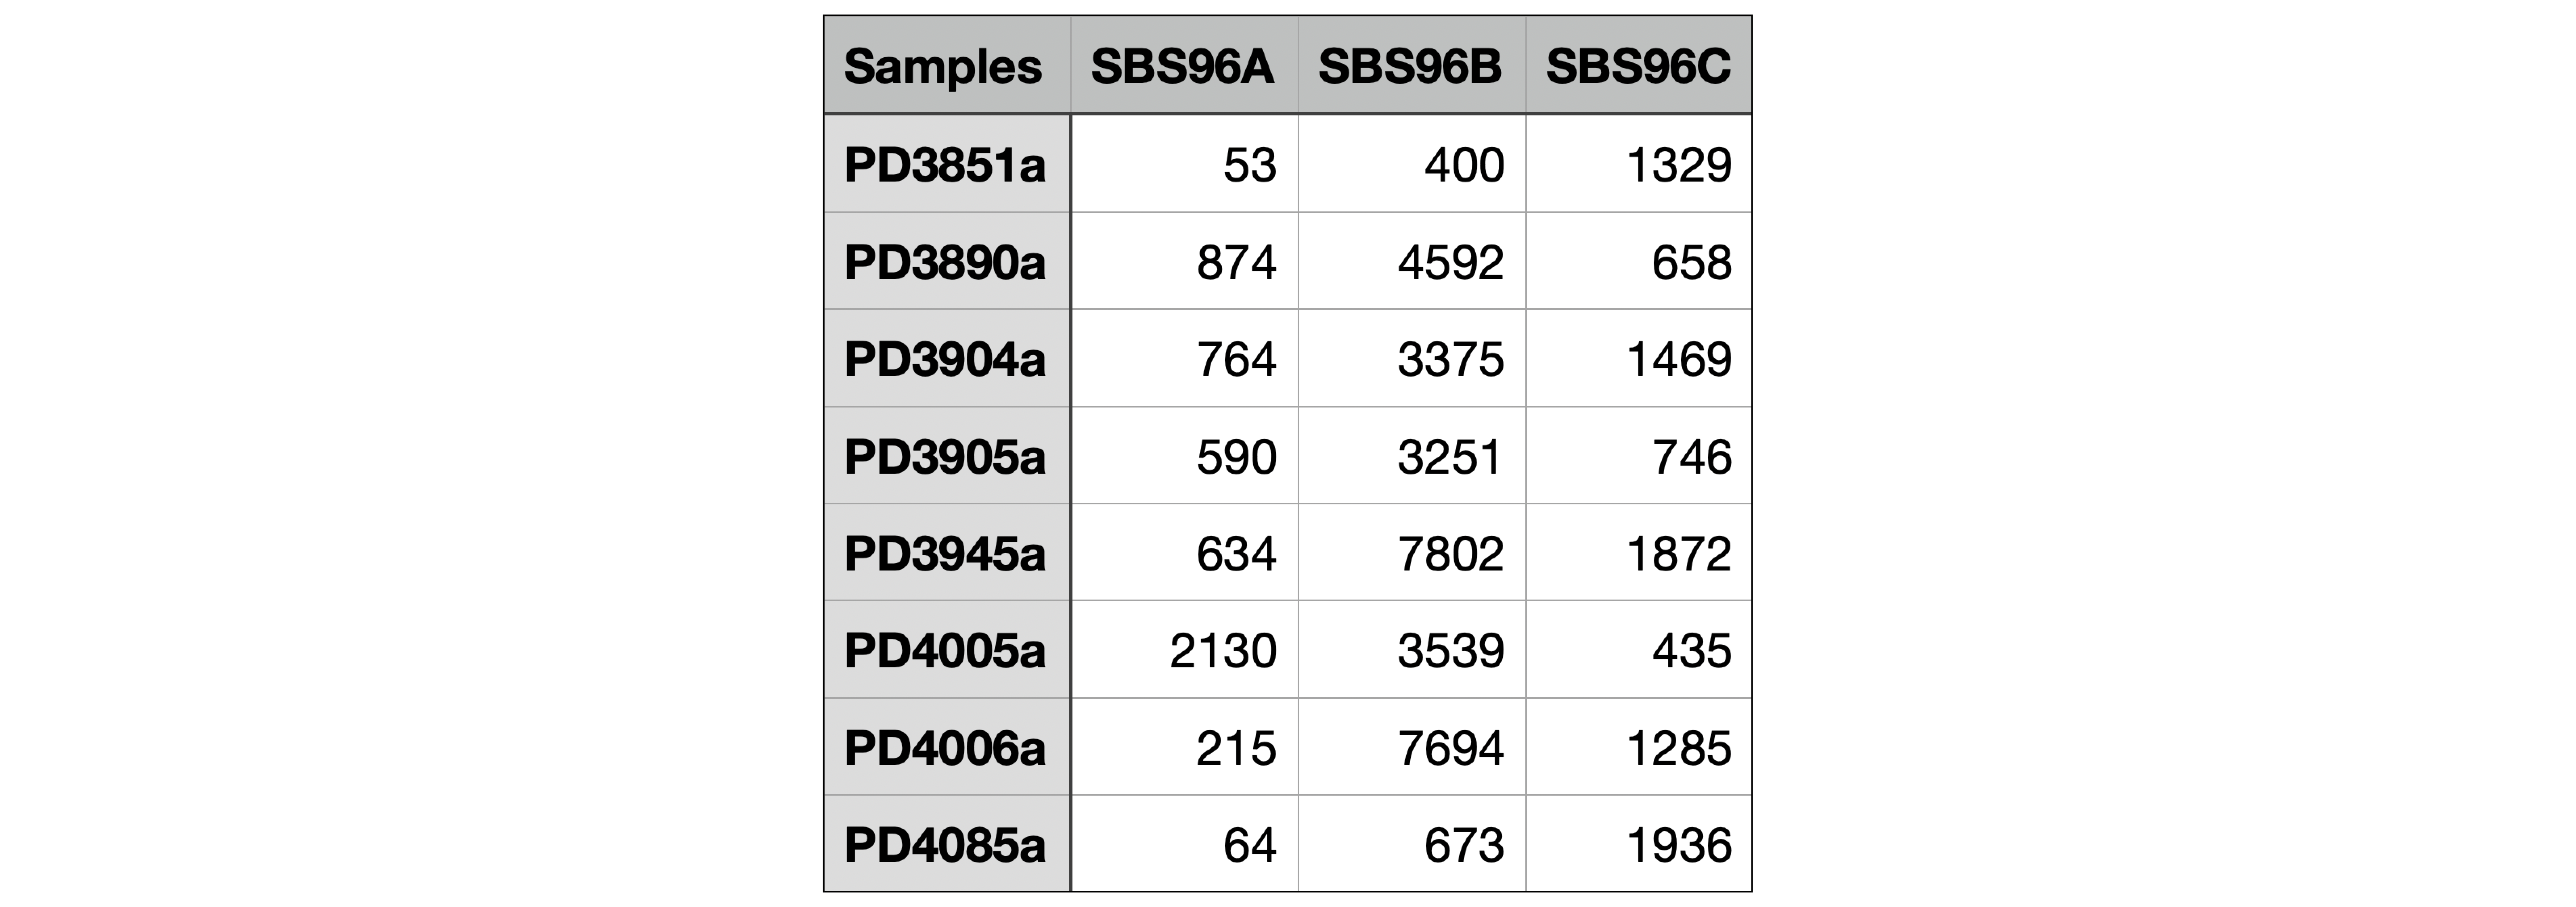
The SBS96_S3_NMF_Activities.txt file contains the activity matrix for the signature. The first column lists all of the samples and the second column lists the calculated activity value for the respective signature. The number of columns is the number of signatures identified.
Below is a screenshot of the first few rows of a sample file, SBS96_S3_Activities.txt. There were three signatures, SBS96A, SBS96B, SBS96C, that were identified.
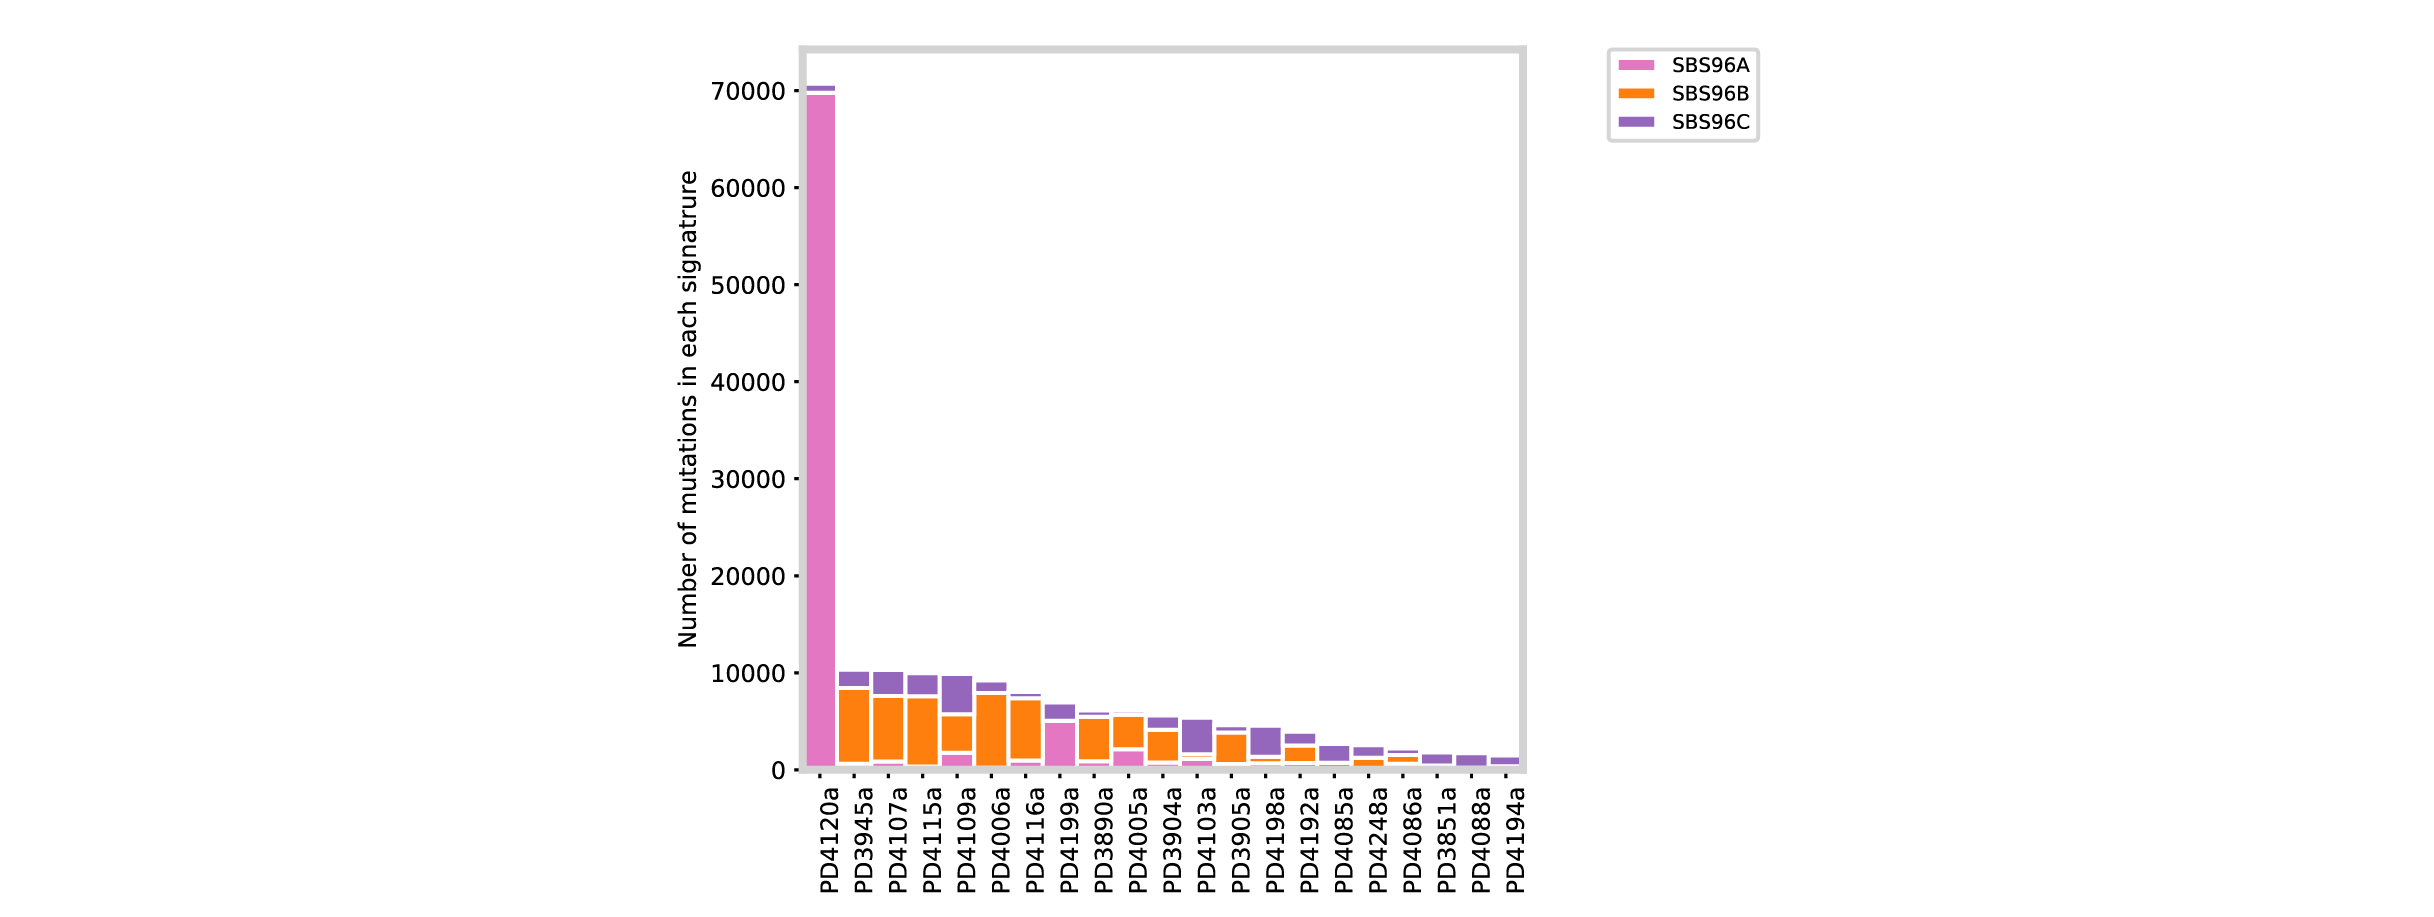
SBS96_S3_NMF_Activity_Plots.pdf
The SBS96_S3_NMF_Activity_Plots.pdf plot shows the number of mutations in each signature on the y-axis and the sample name on the x-axis. The colors indicate which signature had the mutations and which signatures were found in each sample.
SBS96_S3_TMB_NMF_plot.pdf
The COSMIC_SBS96_TMB_plot_refit.pdf file contains a tumor mutational burden plot. The y-axis is the somatic mutations per megabase and the x-axis is the number of samples plotted over the number of samples included. The column names are the mutational signatures and the plot is ordered by the mean somatic mutations per megabase.
Signatures Directory
SBS96_S3_Signatures_SEM_Error.txt
Information about the different signature matrices generated during the run is stored in SBS96_S3_Signatures_SEM_Error.txt. There are different signature matrices from each iteration from which the average is then calculated. The first column lists all of the samples and the subsequent columns lists the error of the average (standard error) for each signature and the respective signature.

SBS96_S3_Signatures.txt
The SBS96_S3_Signatures.txt file contains the contribution of each mutation to the observed signature. The first column lists each mutation possible in the mutational context. There are 96 possible mutations that are considered for SBS96. The following columns are the signatures. In the example the signatures are SBS96A, SBS96B, and SBS96C. Only the first few rows are shown in the image below; however, the sum of each column is 1, and each value in a column indicates the contribution of a mutational context to the signature.
Solutions_Stats Directory
Signature_plotSBS_96_plots_S3.pdf
The Signature_plotSBS_96_plots_S3.pdf has a plot for each signature identified that depicts the proportion of the mutations for that signature and X is that number. For more details on the plots, plotting tools, and interpretation of the plots please refer to the SigProfilerPlotting tool.
In the example below the plot generated for the first signature (SBS96A) identified in the sample input. The top right corner also lists the stability, total number of mutations, and the percentage of total mutations in the mutational signature.
SBS96_S3_NMF_Convergence_Information.txt
The SBS96_S3_NMF_Convergence_Information.txt file contains the L1 norm (calculated as the sum of the absolute values of the vector), L2 norm (calculated as the square root of the sum of the squared vector values), KL divergence between the original and reconstructed matrix for each iteration, correlation, and the number of convergence iterations.
Below is a screenshot of the sample file SBS96_S3_NMF_Convergence_Information.txt.
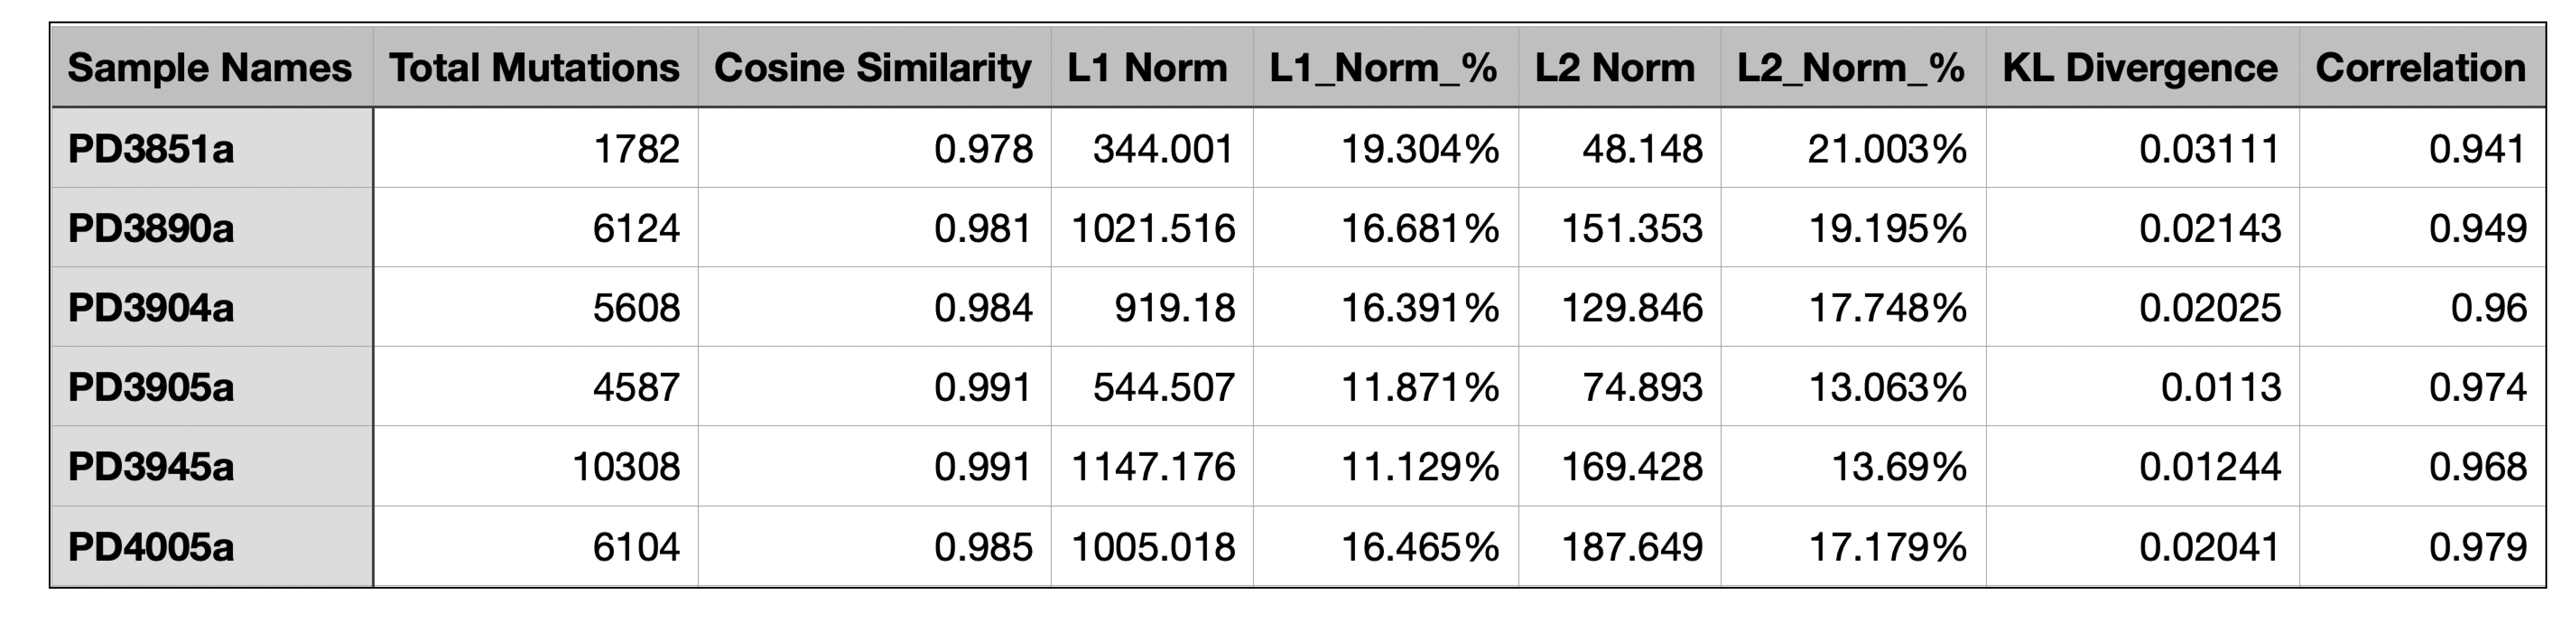
SBS96_S3_Samples_stats.txt
The SBS96_S3_Samples_stats.txt file contains the statistics for each sample including the total number of mutations, cosine similarity, L1 norm (calculated as the sum of the absolute values of the vector), L1 norm percentage, L2 norm (calculated as the square root of the sum of the squared vector values), and L2 norm percentage, along with the KL divergence.
Below is an example of a SBS96_S3_Samples_stats.txt file.
SBS96_S3_Signatures_stats.txt
The SBS96_S3_Signatures_stats.txt file contains the statistics for each of the signatures identified and includes their stability value (calculated average silhouette coefficient) and total number of mutations.